Playing With Pokemons -- The Data Science Way
I’ve always loved anime.
And Pokemon was what got me into anime, as a child.
From the trading cards, to the anime, the video games and even action figures! I’d engage with them all.
I loved Pokemon.
Still do, for that matter. The difference now though, is that I can harness the power of data visualization!
And that’s what this blog post is about.
Oh, by the way - a thank-you to the people who posted the dataset - find it here! - https://www.kaggle.com/abcsds/pokemon/version/2
Finding The Best Pokemon(s)!
Let’s get started! Now finding the best pokemon is a broad and vague objective.
There are many ways of defining “best”. Max HP? Max Strength? Max Attack?
Let’s start with attack!
What’s the average distribution of physical strength among Pokemon?
Visualizing this yields the following result -
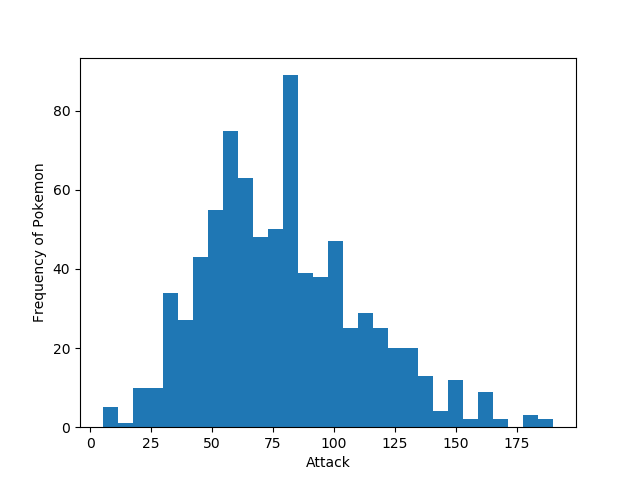
Looks like a normal distribution, and to be honest I expected something similar. Most pokemon are average, some are just disappointingly wasted, and some extend all the way to extreme levels of brute strength.
But what’s this?
Let’s increase the clarity of our histogram by adding more lines and spreading it out to get a better look.
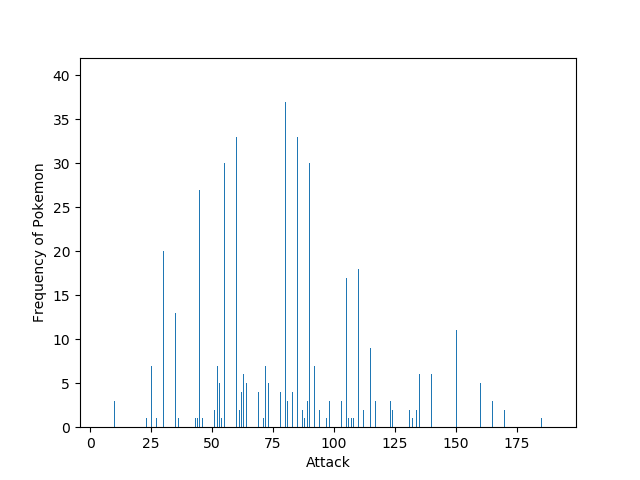
Okay, so here we have a sparse and thin graph and this implies that there are quite a few ranges that aren’t common values.
But something weird sticks out.
The gap between 150 and 200, and the sudden small peak at the right edge.
What does this tell us? I think this is the league of Legendary Pokemons.
Evidently a class above.
Onto Visualizing Health!
Let’s find out which pokemon has the highest health and can take the most beating. The tank of the team.
Plotting out our distribution we see -
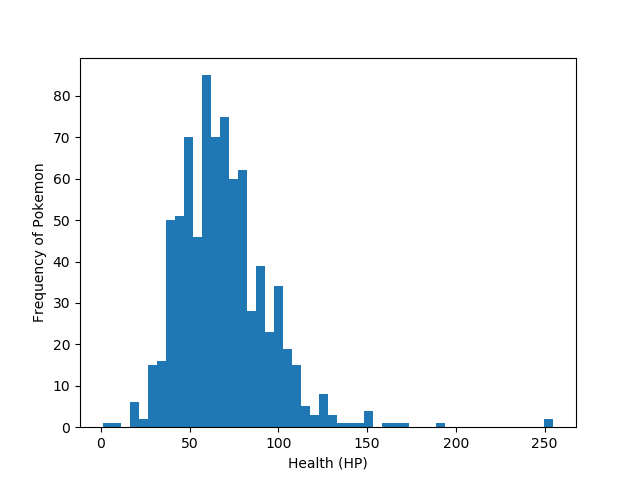
Woah.
There’s an outlier at around 250?!
Let’s make things clearer.
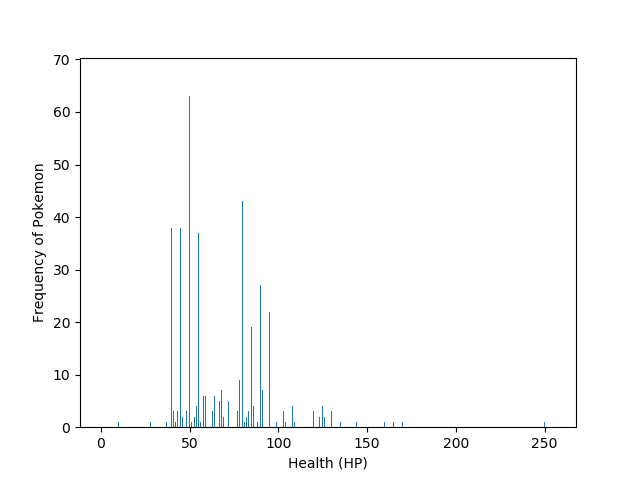
Yep. There are two outliers with an HP of 250, and 255.
What pokemons are these?
Let’s find out.
>>> [pokemons['Name'][i] for i in range(len(pokemons)) if (pokemons['HP'][i] > 200)]
['Chansey', 'Blissey']
Oh. Chansey and Blissey. I guess that makes sense too, for Blissey is what Chansey evolves into – but that is a HUGE difference in the HP these two possess, compared to the average pokemon or even the legendary pokemon!
Well, atleast I know now for sure which pokemon HAS to be on my team, in the next Pokemon video game I play.
Offense Vs Defense
Let’s check out what the general distribution in terms of Offense AND Defense is among pokemon.
Are more pokemon inherently powerful at attacking? Or better at defending?
Or could we expect to see something like the laws of nature, where the predators and prey are clearly defined by specializing in either offense or defense?
Let’s find out!
import matplotlib.pyplot as plt
import brewer2mpl
import numpy as np
import pandas as pd

set2 = brewer2mpl.get_map('Set2', 'qualitative', 8).mpl_colors

fig, ax = plt.subplots(1)

pokemons = pd.read_csv('Pokemon.csv')

x = pokemons['Attack']
y = pokemons['Defense']
color = set2[0]
ax.scatter(x, y, label=str(i), color=color)

plt.xlabel('Attack')
plt.ylabel('Defense')
Here’s what we get!
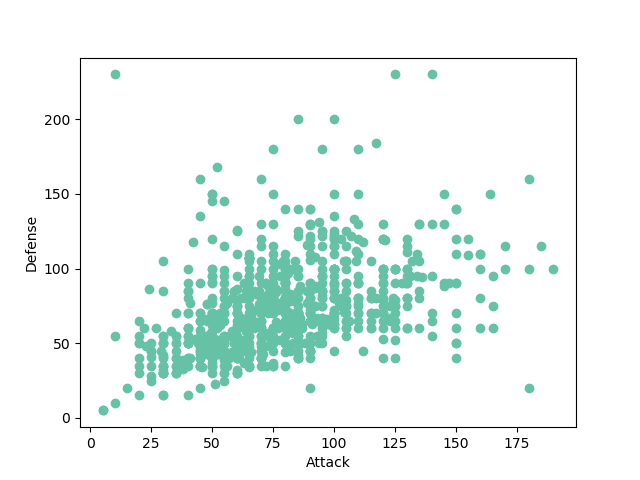
A few outliers. Let’s label our points so we know which Pokemon is located at what co-ordinate.
for i, txt in enumerate(pokemons['Name']):
    ax.annotate(txt, (pokemons['Attack'][i], pokemons['Defense'][i]))
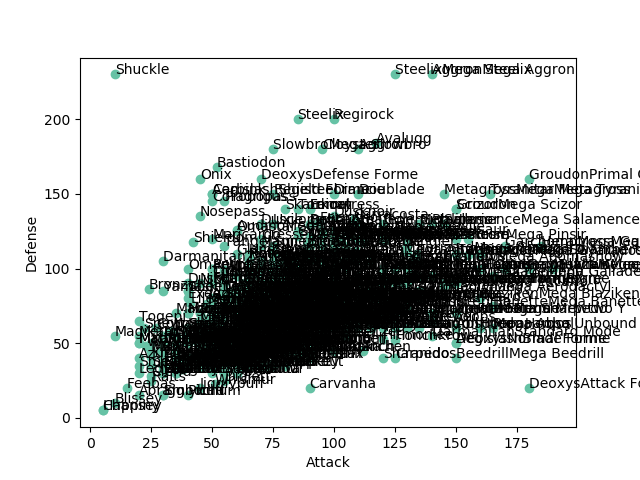
And- Yikes. That’s a lot of names.
But now we know our outliers.
On the top-left, Shuckle is the pokemon with the highest defense-to-attack ratio.
And on the bottom right, we have Deoyxs, a legendary pokemon with the highest attack-to-defense ratio.
It’s also not surprising that many “Mega” Pokemon are in the neighbourhood of legendary pokemon too.
Oh also, Blissey and Chansey are at the bottom left of the graph!
Look at that! Our HP Tanks are super weak in battle.
No wonder they’re not extinct. Top HP game.
Elements!
I wonder what kinds of elemental pairings are most common. Which ones are the rarest?
Are there any that combine to make a completely overpowered pokemon?
Let’s plot out how many Pokemon are associated with all possible pairings of elements.
First I’ll map integers to each type, and hash them accordingly, and also generate a reverse hashmap.
typetoint = dict()
inttotype = dict()

ct = 0
for i in set(pokemons['Type 1']).union(pokemons['Type 2']):
    i = str(i)
    typetoint[i] = ct
    inttotype[ct] = i
    ct += 1
Now, time to declare my heatmap 2D array and iterate over my dataset.
heatmap = [[0 for i in range(len(set(pokemons['Type 2'])))] for j in range(len(set(pokemons['Type 2'])))]

for index, pokemon in pokemons.iterrows():
    t1 = str(pokemon['Type 1'])
    t2 = str(pokemon['Type 2'])
    heatmap[typetoint[t1]][typetoint[t2]] += 1
    heatmap[typetoint[t2]][typetoint[t1]] += 1
My 2D array heatmap now stores the frequency of each pair of elemental types.
Time to get out the plotting tools. I’ll label the X-axis and Y-axis accordingly now.
fig, ax = plt.subplots()

ax.set_xticks(np.arange(len(inttotype)))
ax.set_yticks(np.arange(len(inttotype)))

ax.set_xticklabels(typetoint)
ax.set_yticklabels(typetoint)

plt.setp(ax.get_xticklabels(), rotation=45, ha="right", rotation_mode="anchor")
And now I’ll write into the heatmap, the actual frequencies.
for i in range(len(typetoint)):
    for j in range(len(typetoint)):
        text = ax.text(j, i, heatmap[i][j],
                       ha="center", va="center", color="w")
Let’s display our final result.
ax.set_title('Type Pairings')
ax.imshow(heatmap, cmap='plasma', interpolation='nearest')
plt.show()
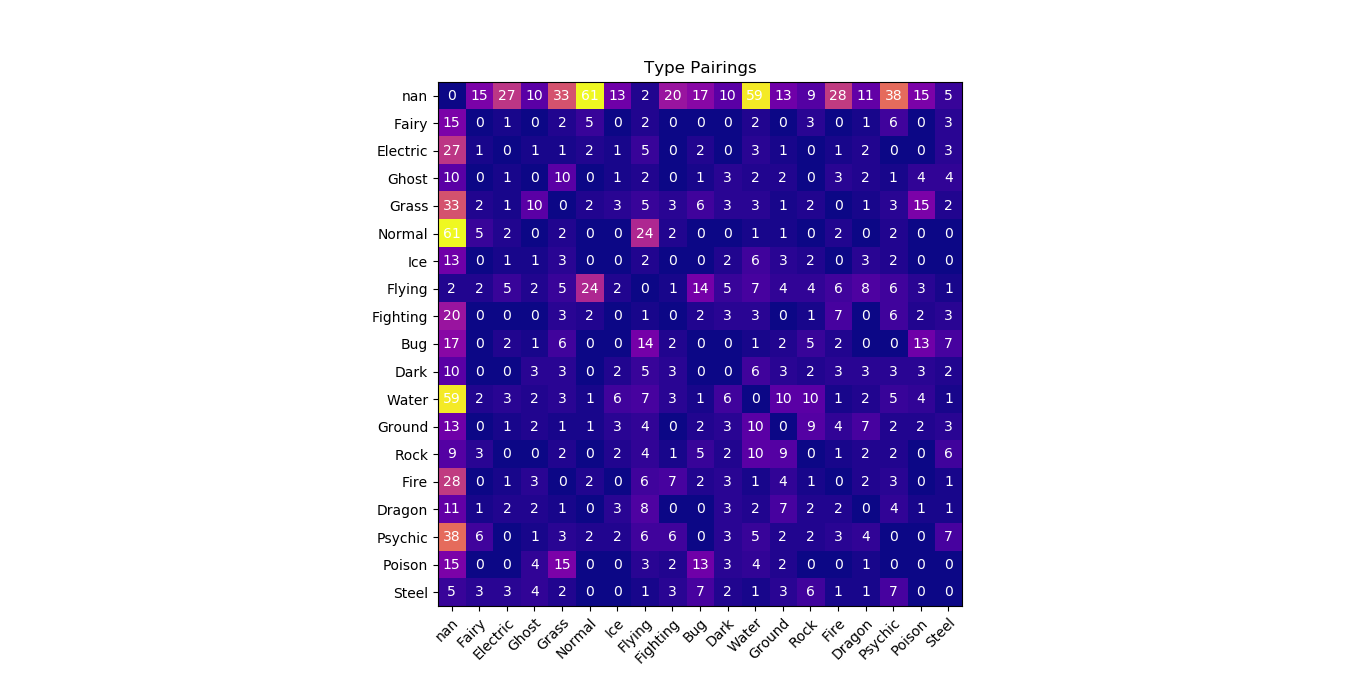
Huzzah!
The League Of Legends
No, not the game. Let’s take a glance at the legendary pokemons. I presume they’ve got a power level of… OVER 900- oops, wrong anime.
Putting aside my bad sense of humor.
Let’s check out their “Total Power”, by that I mean summing up their HP, Attack, Defense, Sp. Attack, and Sp. Defense.
I imagine them to completely wipe the floor with the others here.
Let’s see.
for i in range(len(total)):
    if legendary[i] == True:
        legendline.append(total[i])
    else:
        normalline.append(total[i])
Now that we’ve got the ordinates of all the total power levels of legendary and normal pokemon, let’s plot ‘em out.
plt.plot([i for i in range(len(normalline))], normalline)
plt.plot([i for i in range(len(legendline))], legendline)

plt.legend(('Normal Pokemon', 'Legendary Pokemon'))

plt.xlabel('Pokemons')
plt.ylabel('Total Power')
Running plt.show(), we get -
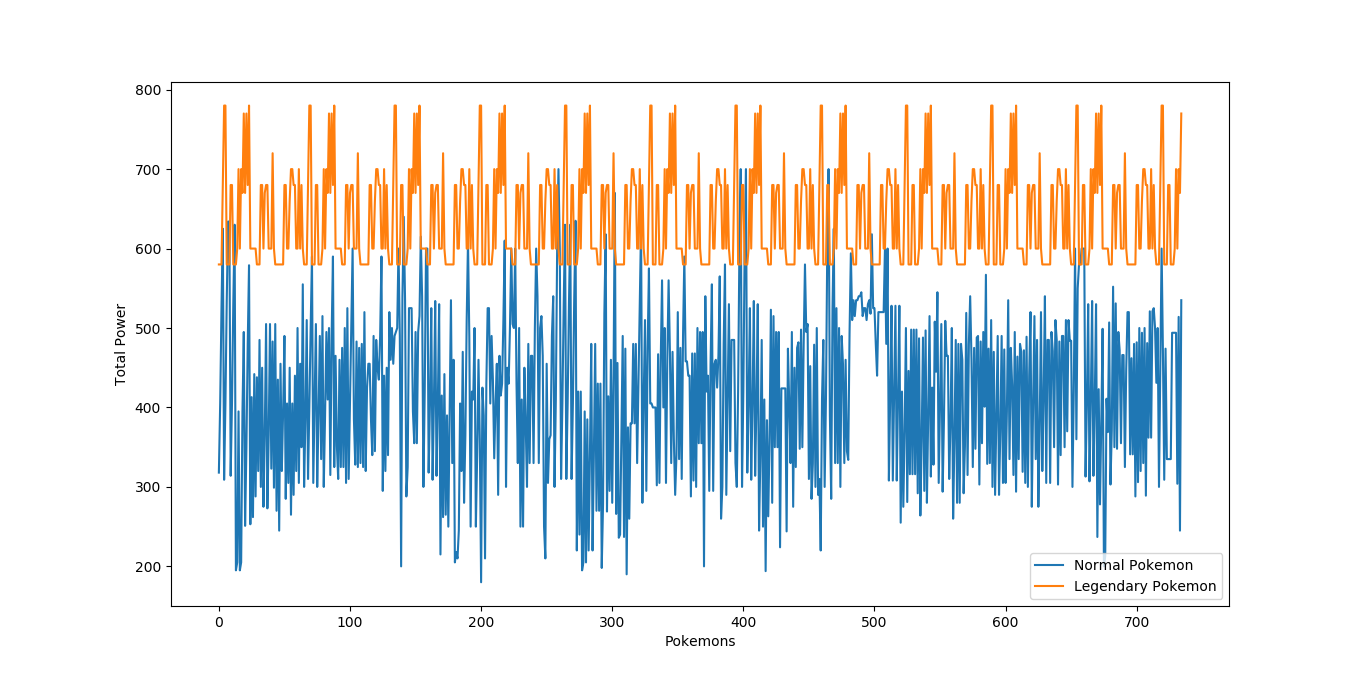
Yep. Unsurprisingly, most legendary pokemons are way ahead of normal pokemon, although evidently the weakest legendaries are weaker than stronger non-legendary pokemons.
Let’s find out which non-legendary pokemons can take on the weakest of legendaries -
>>> min(legendline)
580
So we now have the weakest legendary pokemon’s power level.
>>> [i for i in range(len(pokemons)) if legendary[i]==False and total[i]>580]
[3, 7, 8, 12, 71, 87, 102, 124, 137, 141, 154, 161, 165, 196, 224, 229, 232, 248, 267, 268, 271, 275, 279, 283, 306, 313, 333, 366, 408, 409, 412, 413, 493, 494, 498, 511, 527, 546, 548, 696, 715, 716, 717, 776]
The above command gets us the indices of all pokemon in the dataset which are not legendary and yet have a total power level greater than the weakest legendary pokemon.
>>> names = list(pokemons['Name'])
>>> arr = [i for i in range(len(pokemons)) if legendary[i]==False and total[i]>580]
>>> for i in arr:
    print(names[i])
This will give us the list of all non-legendary pokemon that can go toe-to-toe with legendaries.
And that list is…
VenusaurMega Venusaur
CharizardMega Charizard X
CharizardMega Charizard Y
BlastoiseMega Blastoise
AlakazamMega Alakazam
SlowbroMega Slowbro
GengarMega Gengar
KangaskhanMega Kangaskhan
PinsirMega Pinsir
GyaradosMega Gyarados
AerodactylMega Aerodactyl
Dragonite
Mew
AmpharosMega Ampharos
SteelixMega Steelix
ScizorMega Scizor
HeracrossMega Heracross
HoundoomMega Houndoom
Tyranitar
TyranitarMega Tyranitar
Celebi
SceptileMega Sceptile
BlazikenMega Blaziken
SwampertMega Swampert
GardevoirMega Gardevoir
Slaking
AggronMega Aggron
AltariaMega Altaria
Salamence
SalamenceMega Salamence
Metagross
MetagrossMega Metagross
Garchomp
GarchompMega Garchomp
LucarioMega Lucario
AbomasnowMega Abomasnow
GalladeMega Gallade
Cresselia
Manaphy
Hydreigon
MeloettaAria Forme
MeloettaPirouette Forme
Genesect
Goodra
And there we have it!
A ton of visualizations and inferences on Pokemon, just for fun.
Liked my blog post? Follow and connect with me for more!
| GitHub | https://github.com/RameshAditya |
| https://linkedin.com/in/AdityaRamesh1998 | |
| https://twitter.com/@adityaramesh98 | |
| Portfolio | https://rameshaditya.github.io/ |
| Blog | https://blogarithms.github.io/ |